


Financial Reporting
ProPivot develops comprehensive financial reports for portfolio and fund managers as well as standard revenue-unit-margin reports for manufacturing and trading companies. Professionally designed summary reports for your clients or internal analytical reports provide an overview of the most important metrics such as:
- Net Asset Value
- Portfolio positions
- Indices and benchmark metrics
- Performance statistics: Year on Year, Year to Date, Month to Month comparison, since inception performance…
- Additional statistics for return distribution: Variance, Mean return, Mode return, Standard Deviation, Percentiles…
- Detail views of portfolios and fund breakdowns (by geographical location, by contributing funds…)
- Overview of hedge ratio and risk
- Plain metrics can be amended by wording
- All metrics can be in form of tables or sophisticated charts
In order to develop reporting solutions fitting your organization needs, following design approaches can be applied.
Custom reporting solutions
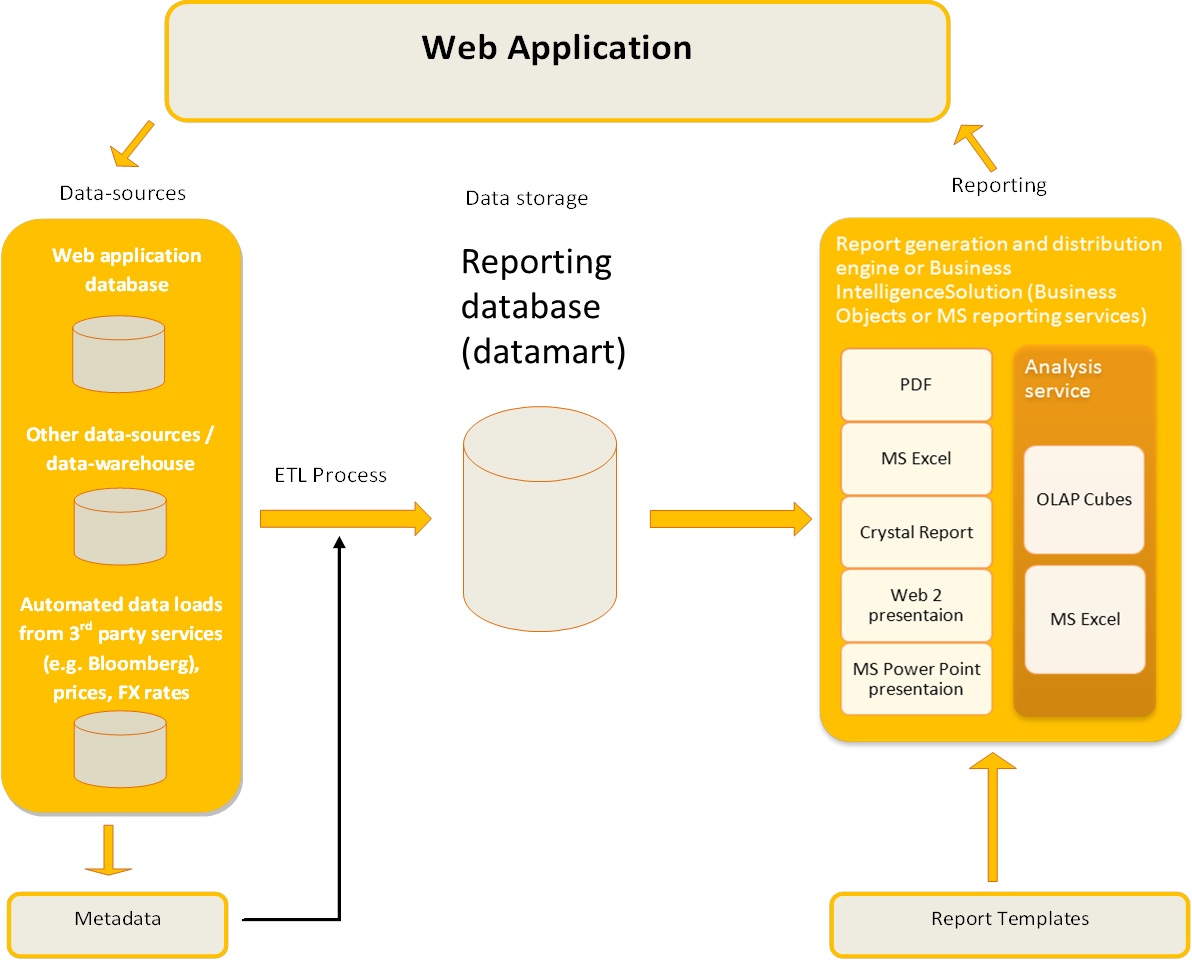
In order to develop reporting solutions fitting your organization needs, following design approaches can be applied:
- Data-source layer: In this layer data is preserved in application friendly structures, which enables easy web application and data-entry tools modifications according to business needs. Metadata driven ETL (Extract, transform and load) processes are used to load data into reporting databases or datamarts. The process can be easily modified to adopt changes in web applications and data-entry tools using change information provided in meta-data.
- Data storage layer: Reporting databases or datamarts stores organization’s data in structures ready for reporting, analysis and aggregation purposes. These databases have the granularity and normality for effective analysis and reporting tools. Datamarts keeps historical data and enables metric comparisons in time.
- Reporting layer: This layer provides functionality for report generation
based on templates and in various output formats. PDF web 2 based reports can employ advanced layouts with a professional design.
Silverlight and Flash technologies are specifically suitable for interactive and animated charts for web presentation. The
Crystal Reports and MS Excel maybe used for analytical reports giving the users some interactive features as well.
- Report distribution functionality can be provided by a web application or some robust solution such as SAP Business Objects or MS Reporting services.
- OLAP Analysis Services are running smoothly on properly normalized data structures of reporting database.
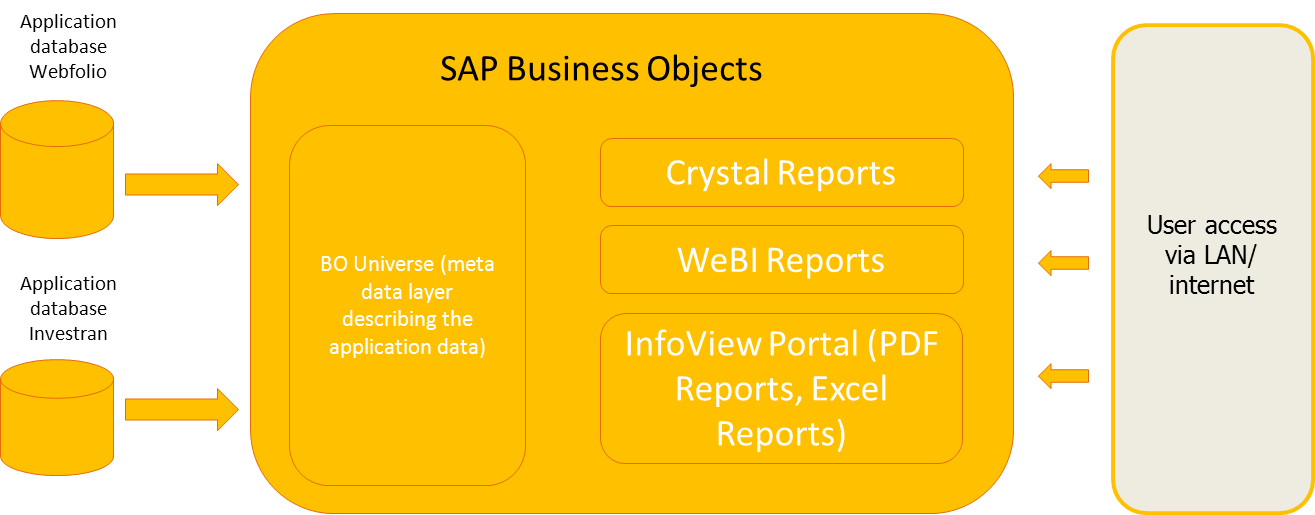
Business Objects based reporting
- Business Objects platform provides fully automated report generation system linked directly to production/application database.
- Business logic is represented by metadata description universe, this always allows up to date data to be loaded into the reports.
- System provides functionality for analytical tools (Webintelligence and DeskIntelligence) and allows development of parametric and historical reports.
- Business Objects InfoView portal provides advanced features for scheduling and distribution of the reports via local network or internet.
In order to see our sample reporting showcase, please log into the demo application here.
Back